Reykholt Data Insights was founded to help small business owners move past messy spreadsheets and manual reporting. I turn your raw data into live, visual dashboards that show you exactly how your business is performing - in real-time.
The problem: Many small businesses only assess their true financial infrequently - perhaps when the bookkeeper updates the accounts each month, or when they remember to check the bank balance or even waiting until the end-of-year account filing. Perhaps they run some Excel spreadsheets graphs that take up valuable time as well as adding human error which can confuse the picture. The greater the separation between the business owner and the true financial picture, the harder it is to understand the business and make important decisions.
The solution: I bridge that gap. As a Business Intelligence Analyst, I use dashboards to unlock the data hidden in your rows and columns. Instead of staring at a table of numbers, you get visuals that make patterns and trends jump off the screen. I provide you with a dashboard that you can view in your browser whenever you need to and wherever you are.
The result: Whether you employ twenty people or fifty, I give you the "heartbeat" of your business in high definition. You stop guessing which expenses eat your margins and start making bold, data-backed decisions today. Scroll down to read more about my approach and the technology I use to help you.

A data dashboard is an online tool that collects and displays important information in a visual, easy-to-understand format. Instead of looking through raw data in spreadsheets or databases, a dashboard presents key metrics using charts, graphs, and summary figures so users can quickly see what is happening at a glance. Because it is hosted online, it can be accessed through a web browser from anywhere and updates automatically as new data becomes available.
The tools I use are primarily Metabase and Power BI. There are differences between the two that mainly come down to costings.
Metabase: If you choose Metabase for your dashboard, then access is included in your Reykholt Data Insights monthly suscription. I host it on my VPS and provide you with either access via my website, or you can embed your dashboard into your own website and control access your end. Because Metabase is open-source, I can host it for you without the per-head license fees. You can share your data with your whole team without your bill skyrocketing. Overall, this provides the cheapest and easiest option for smaller budgets.
Power BI: Power BI is a Microsoft tool and dashboards are publised on their online service. However, there is an extra cost involved as each user is required to have a Power BI Pro licence, so on top of your Reykholt Data Insights monthly subscription you would need to factor in the Power BI Pro licence cost for each user.
Dashboards provide the following features:
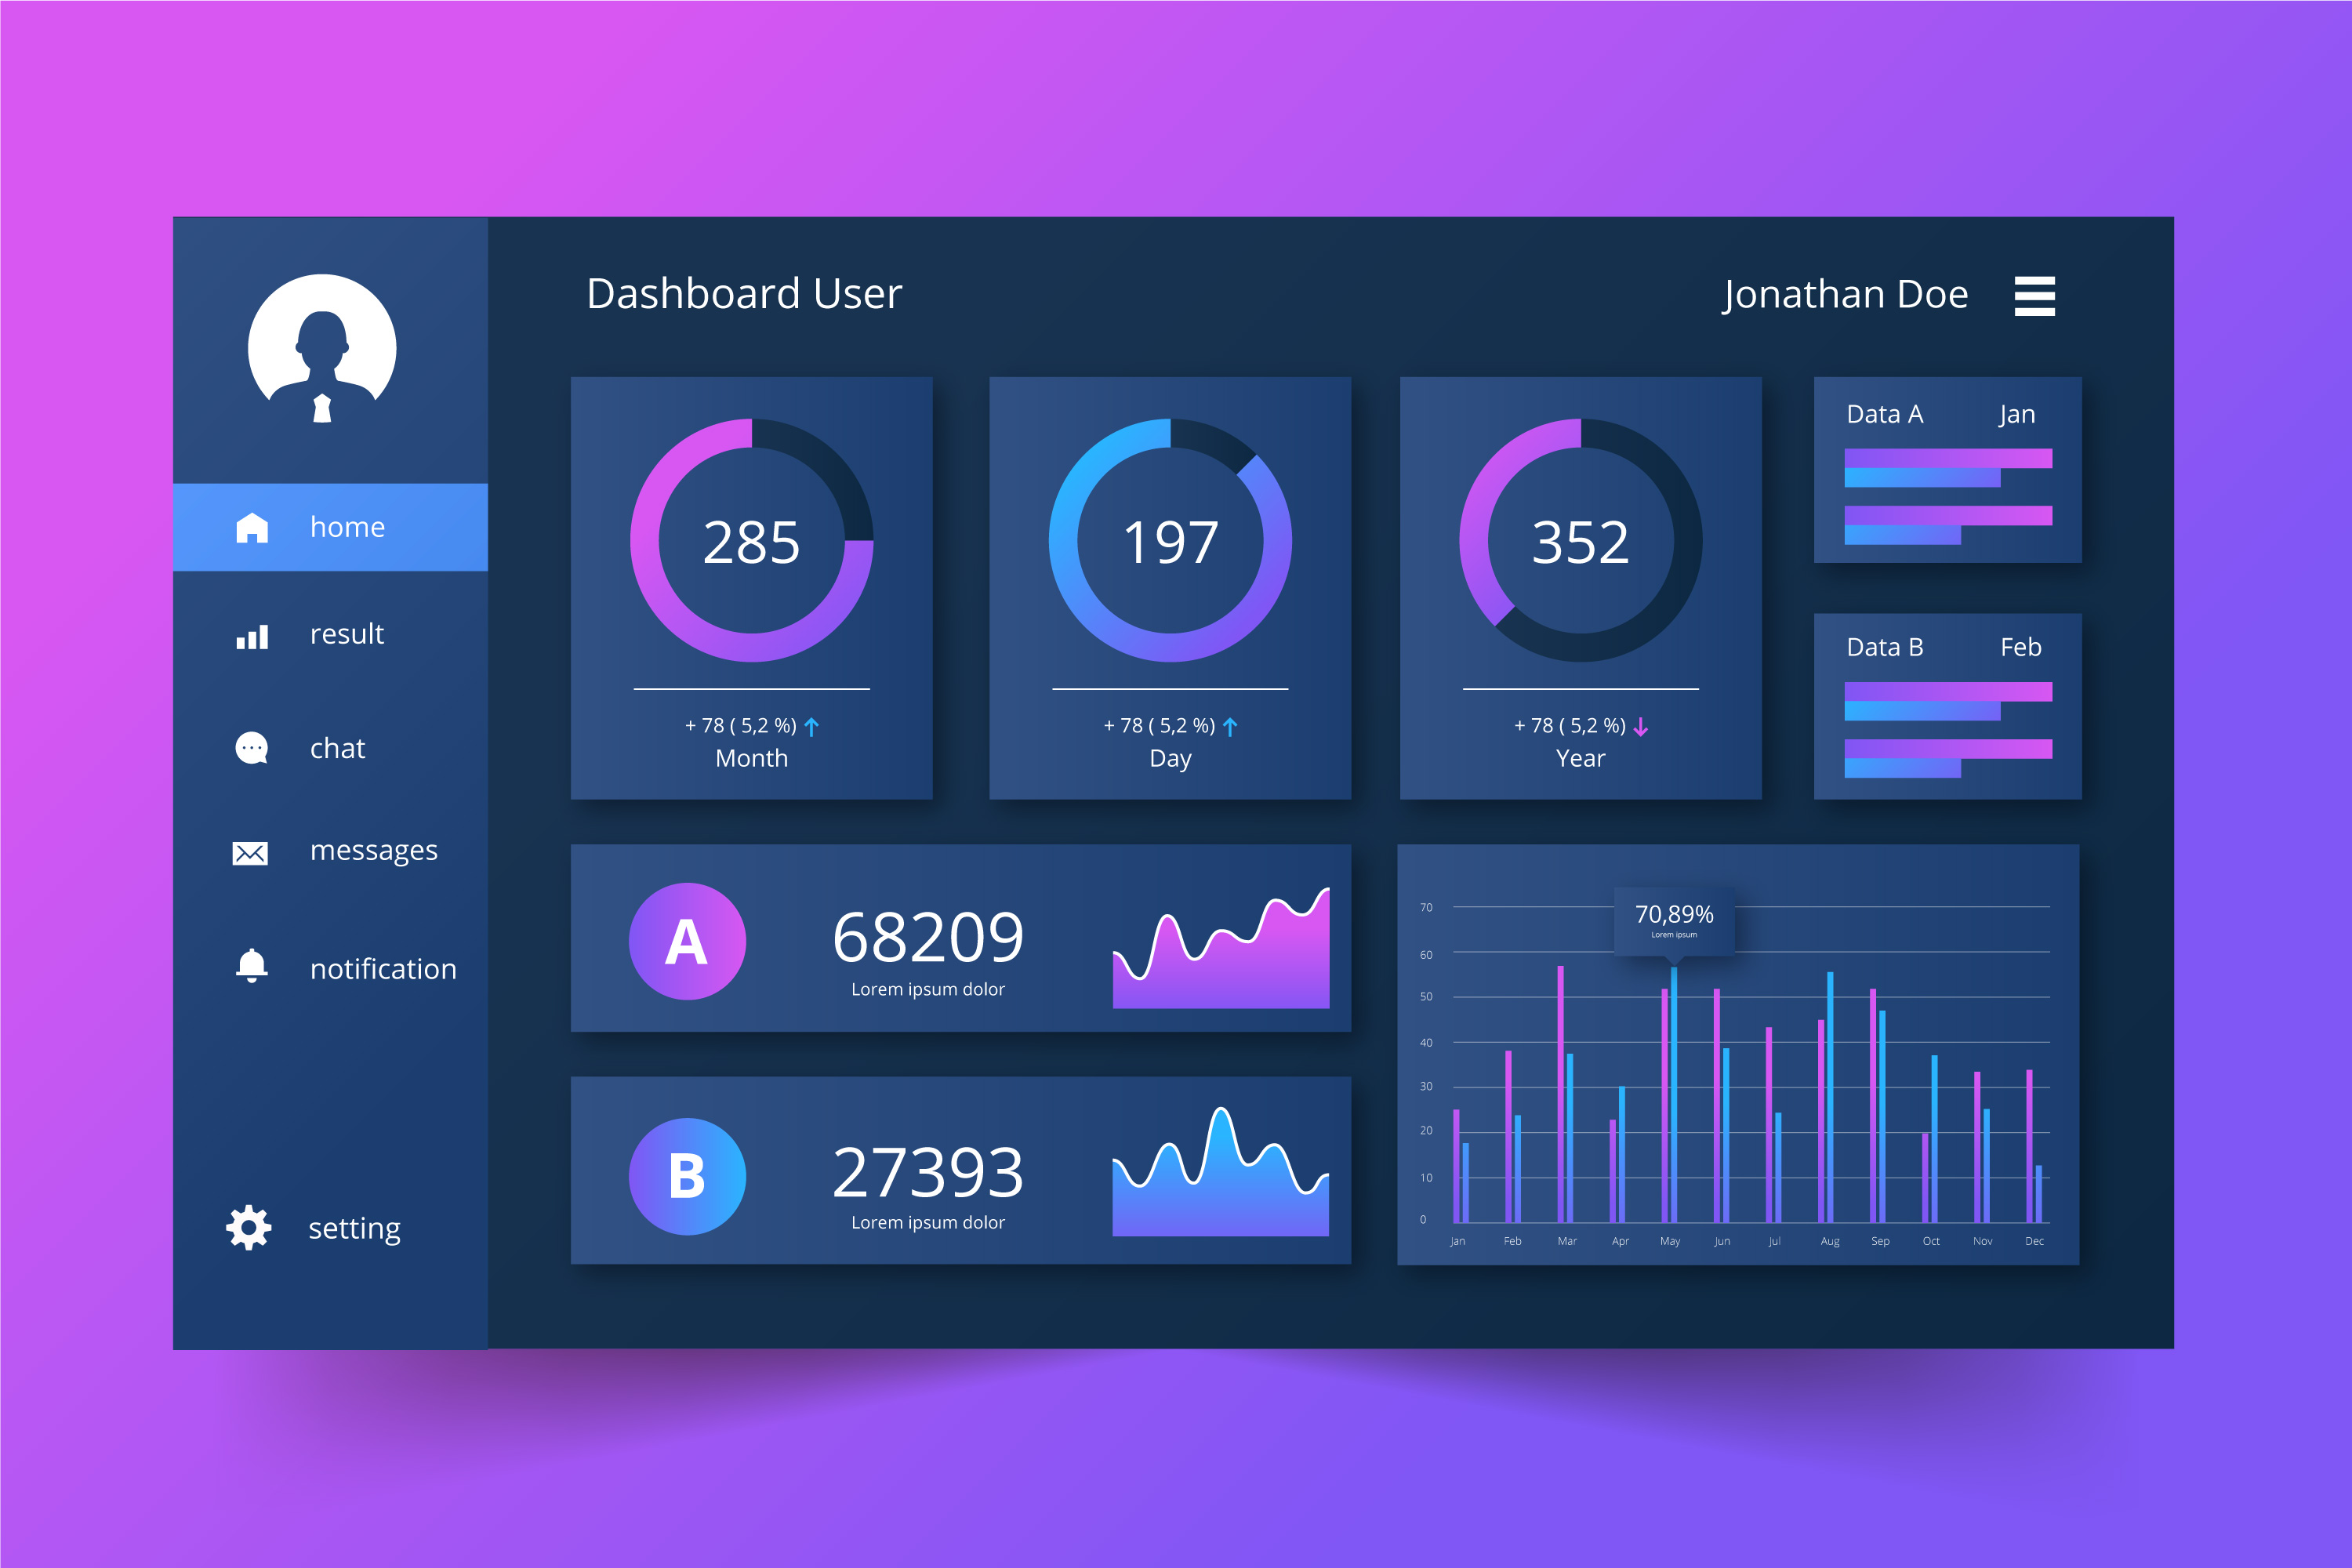
Data dashboards are important for businesses - they are your insight into the heart of it allowing you to:
You are an expert in your business; you shouldn't have to be an expert in data engineering. That's where I come in.
My simple approach:
You focus on the what and the why - I'll handle the how

Professional-grade data shouldn't be reserved for big corporations with massive budgets. I know that small business cannot justify thousands of pounds in fees for enterprise data licences for each user and on top of that employ dedicated data analysts and engineers. With that in mind, I have developed:
An initial build fee: A one-off cost to design your custom data architecture and build your bespoke dashboards.
A monthly insight subscription: A flat monthly fee that covers:
Further project add-ons - Need a brand new dashboard or a major feature? Additional development is always available!